Preferential Signaling and Induction of Allergy-promoting Lymphokines Upon Weak Stimulation of the High Affinity IgE Receptor on Mast Cells
Abstract
Mast cell degranulation and de novo cytokine production is a consequence of antigen-aggregation of the immunoglobulin E (IgE)-occupied high affinity receptor for IgE (FcɛRI). Herein, we report that lymphokines that promote allergic inflammation, like MCP-1, were potently induced at low antigen (Ag) concentrations or at low receptor occupancy with IgE whereas some that down-regulate this response, like interleukin (IL)-10, required high receptor occupancy. Weak stimulation of mast cells caused minimal degranulation whereas a half-maximal secretory response was observed for chemokines and, with the exception of TNF-α, a weaker cytokine secretory response was observed. The medium from weakly stimulated mast cells elicited a monocyte/macrophage chemotactic response similar to that observed at high receptor occupancy. Weak stimulation also favored the phosphorylation of Gab2 and p38MAPK, while LAT and ERK2 phosphorylation was induced by a stronger stimulus. Gab2-deficient mast cells were severely impaired in chemokine mRNA induction whereas LAT-deficient mast cells showed a more pronounced defect in cytokines. These findings demonstrate that perturbation of small numbers of IgE receptors on mast cells favors certain signals that contribute to a lymphokine response that can mediate allergic inflammation.
Keywords: cytokines, Gab2, IgE, LAT, mast cells
Introduction
Mast cells function in innate and acquired immunity (1, 2) and likely through evolutionary adaptation have acquired a role in the allergies (3). These cells perform their physiological role by responding to a diverse array of challenges through various receptors expressed on their surface and by releasing a variety of compounds that enhance an immune response. Central to allergic disease is the expression of the high affinity Fc receptor for IgE (FcɛRI) on mast cells (4). This receptor becomes occupied by allergen-specific IgE primarily produced in response to T cell-dependent activation of B cells. Aggregation of IgE-occupied FcɛRI by a specific allergen causes the production of mRNA or protein of IL-1, IL-2, IL-3, IL-4, IL-5, IL-6, IL-10, IL-12, IL-13, TNF-α, TGF-β, GM-CSF, IFN-γ, monocyte chemoattractant protein 1 (MCP-1),* macrophage inflammatory protein 1α (MIP1α), MIP1β, TCA3, LIF, ET-1, MARC, and others (5, 6).
Heterogeneity in cytokines produced by different mast cell populations is a well-documented phenomenon. Purified mouse serosal mast cells were shown to produce IL-3, IL-6, TGF-β1, and TNF-α (7–9) but a similar population of rat mast cells produced only IL-6 and TNF-α (10, 11). These differences in the profile of produced cytokines can also be seen in vitro by modifying culture conditions. For example, addition of stem cell factor (c-KIT ligand) to a bone marrow–derived mast cell (BMMC) causes selective expression of IL-12 but not IL-4. In contrast, BMMC cultivated in the presence of only IL-3 were reported to contain mRNA for IL-4 but not for IL-12 (12). This heterogeneity of cytokine gene expression seemingly extends to human tryptase+ chymase− mast cells (MCT) and tryptase+ chymase+ mast cells (MCTC) as IL-5 and IL-6 were restricted to MCT from allergic rhinitis patients whereas MCTC preferentially expressed IL-4 and minimal IL-5 or IL-6 (13, 14). Furthermore, whereas 90% of purified human foreskin mast cells are positive for IL-4, only a small number of these cells showed immunoreactivity for IL-5 and IL-6 (14).
This plasticity in mast cell phenotype makes the mast cell a particularly useful effector cell, capable of responding appropriately to changes in its microenvironment, in both innate and acquired immunity (1, 2). However, this characteristic also makes it difficult to gain an understanding of the molecular mechanisms governing a mast cells lymphokine response to a given stimulus, as generalization of the observations is not possible given that the influence of the microenvironment may not be known. In the current study we sought to address whether an environmentally homogeneous population of mast cells can differentially express cytokine and/or chemokine genes as a result of an IgE-mediated challenge. Specifically, we sought to answer whether differences in the Ag concentrations or the extent of FcɛRI occupancy with antigen-specific IgE could cause differences in mast cell responses. The present study shows that mast cells' chemokine and cytokine responses, to a given Ag, can differ depending on the antigen concentration or occupancy of FcɛRI. This reveals a new regulatory mechanism where a weak mast cell stimulus elicits a Th2-like lymphokine response that supports allergic inflammation.
Materials and Methods
Reagents and Antibodies and Radiolabeling.
Dinitrophenyl (DNP)-specific mouse IgE was produced as described previously (15). Rabbit antibodies to ERK2, JNK1, and p38MAPK were from Santa Cruz Biotechnology, Inc., mouse anti-phospho-ERK2, rabbit anti-phospho-JNK, and rabbit anti-phospho-p38MAPK were from Cell Signaling Technologies. Rabbit anti-phospho-Akt (Ser472/473/474) was from BD Biosciences. Secondary antibodies used for immunoblotting were: sheep anti–mouse IgG-horseradish peroxidase (HRP) and donkey anti–rabbit IgG-HRP (Amersham Biosciences). DNP-human serum albumin (DNP-HSA, Ag), monovalent hapten DNP-lysine (Hap), murine thrombin, and ATP were from Sigma-Aldrich. The MEK1 inhibitor, PD 98059, and the p38MAPK inhibitor, SB202190, were from Calbiochem. Iodination of IgE was as described (16) with the exception that an Iodo-Gen precoated tube (Pierce Chemical Co.) was used. The concentration and bindability of the iodinated IgE was determined as described previously (16).
Bone Marrow Isolation and BMMC Culture.
Animals were maintained and used in accordance with National Institutes of Health (NIH) guidelines. Bone marrow was isolated from 8-wk-old SV129 × C57/bl6 wild-type and gene-disrupted mice as described (17, 18). LAT-null mice were kindly provided by L.E. Samelson (NCI, NIH). Cell responses of the genetically-altered mice were compared with age and sex matched wild type litter mates. BMMCs were grown in RPMI media supplemented with FBS and IL-3 as described (17, 18). Because IL-3 induces cytokine mRNA responses, cells were removed from IL-3 for 4 h before stimulation.
Receptor Occupancy and Hapten Experiments.
BMMCs (1 × 10⁶ cells/ml) were incubated in IL-3 free media containing 0.5 μg of IgE/ml (sensitization) during 4 h at 37°C; conditions that result in 100% receptor occupancy. To achieve varying degrees of receptor occupancy the iodinated-DNP-specific mouse IgE was mixed at varying ratios with unlabeled rat IgE of unknown specificity. The degree of FcɛRI occupancy with DNP-specific IgE was determined by direct calculation of the cell surface bound [125I]-DNP–specific IgE after removal of the unbound iodinated-IgE by centrifugation through phtalate oils as described (19). The remaining cells were washed twice by centrifugation (300 g, 10 min) to remove the unbound IgE, stimulated with Ag as described below and the extent of degranulation, cytokine mRNA levels and protein secretion, and MAP kinase activation was determined.
To analyze the effect of hapten on cytokine and chemokine mRNA expression, BMMCs were sensitized as above with saturating amounts of unlabeled DNP-specific IgE and washed twice in Tyrodes/BSA (10 mM HEPES, 130 mM NaCl, 5 mM KCl, 1.4 mM CaCl2, 1 mM MgCl2, and 5.6 mM glucose containing 0.05% BSA) at 37°C. Cells were resuspended in the same buffer at 2 × 10⁶/ml and three aliquots (1 ml) were transferred to tubes containing: (a) 20 μl Tyrodes/BSA, or (b) 20 μl of Hap (2.5 mM) or (c) 20 μl of Hap (2.5 mM) + 30 ng Ag and incubated at 37°C. The remaining cells were also stimulated with 30 ng/ml of Ag at 37°C and 1 ml aliquots were placed in three tubes (one at 37°C, one on ice, and other at 37°C with 10 μl of Hap, 5 mM) at the indicated times. Incubation continued for 60 min and hexosaminidase release was then determined. Cell pellets were used for total RNA isolation.
Lysates, Immunoblots, Akt, MAP Kinase Analysis.
For preparation of cell lysates, IgE-sensitized BMMC (7 × 10⁶) were stimulated for various times or with different concentrations of Ag in a final volume of 250 μl. The reaction was stopped by the addition of 250 μl of boiling SDS sample buffer. For MAP kinase experiments using hapten competition, 100 ng/ml of DNP-HSA was added at t = 0, hapten (50 μM final) was added at the indicated times and incubated for 10 min at 37°C before stopping the reaction with SDS sample buffer. Immunoblotting conditions were previously described (20, 21). Akt or MAP kinase phosphorylation was determined by phosphospecific antibodies. Relative quantitation of immunoblots was performed by densitometry. To determine the effect of MAP kinase inhibitors, PD98058 (10 μM, MEK1 and thus ERK2 selective) or SB202190 (5 μM, p38MAPK selective) was added to 5 × 10⁶ cells/ml for 15 min at 37°C before Ag stimulation (100 ng/ml) for 1 h at 37°C. Cells were centrifuged and the pellet was used to isolate total RNA.
Hexosaminidase, Chemotaxis, and Cytokine Assays.
Degranulation was measured by assaying β-hexosaminidase release as described (18). To measure chemotaxis, mast cells were loaded with different amounts of [125I]odinated-DNP-specific IgE as described above. Thirty million cells were resuspended in 1 ml of Tyrodes/BSA buffer at 37°C and stimulated with Ag (100 ng/ml) or with an equal volume of buffer for controls. Cells were centrifuged and supernatants collected after 1, 2, or 4 h of stimulation. Chemotaxis was measured by Boyden's blind well chamber technique using 48-well microchambers (Neuroprobe) essentially as described (22). The number of cells migrating through the filter was determined microscopically. To measure lymphokine secretion, BMMCs (5.0 × 10⁷ cells) were incubated with IgE as described above to achieve known receptor occupancies. Cells were stimulated with Ag (10 or 100 ng/ml) at 37°C for varying times (1–24 h) and centrifuged at 4°C for collection of the supernatant. Lymphokine concentration was determined by ELISA (Biosource International) as previously described (23).
RNA Extraction, RT-PCR, and Ribonuclease Protection Assay.
Pellets from stimulated cells (2 × 10⁶ per sample) were solubilized in 1 ml of TRI-Reagent (Molecular Research Center) for 15 min at room temperature. Low abundance mRNA was measured by RT-PCR. First strand cDNA synthesis was with the Life Technologies SuperScript first-strand synthesis system. Primers for amplification of IL-2, IL-3, IL-4, IL-10, and IFN-γ were obtained from CLONTECH Laboratories, Inc., and PCR conditions were: 96°C for 1 min; 2 cycles of 96°C for 1 min and 60°C for 4 min; 28 cycles (IL-4) or 35 cycles (IL-2, IL-3, IL-10, IFN-γ) of 94°C for 1 min, 60°C for 2.5 min, and 72°C for 4 min, additional extension at 72°C for 10 min; and holding at 4°C. Cytokine mRNA detection was linear. Fragments were separated on 2% TBE-agarose gels and a negative exposure was used for densitometric quantitation.
For ribonuclease protection assay (RPA), either commercially available multiprobe template sets or two custom-made templates were used (BD Biosciences). Cytokine genes included were TNF-α, IL-13, M-CSF, LIF, and IL-6. Chemokine genes were MIP1β, MIP1α, MIP-2, LIF, and MCP-1. L32 and GAPDH were control genes. Probe synthesis was with RiboQuant™ In vitro Transcription Kit (BD Biosciences) and 100 μCi of [α-33P]-UTP (ICN Biomedicals), following the provided protocol. Hybridization used 10 μg of total RNA and 106 cpm of probe in 13 μl of hybridization buffer at 56°C overnight. RNaseI digestion and subsequent steps were per manufacturer's instruction. Precipitation of protected fragments was in the presence of 1.5 μg of carrier, glycoblue (Ambion). Fragment resolution was on a denaturing 6% polyacrylamide gel, which was autoradiographed and developed in Kodak Biomax Transcreen-LE using Kodak BioMax MS (Eastman Kodak Co.) film. Quantitation of the autoradiograph was by densitometry using ImageQuant® software version 3.3 from Molecular Dynamics. Data was normalized to the control genes L32 or GAPDH.
Results
Mast Cell Cytokine mRNA Profiles Are Similar in Response to Different Stimuli.
We initially tested the hypothesis that differential expression of mast cell cytokine mRNA could occur as a consequence of the stimulus used to activate the cell. Cells were stimulated with IgE/Ag, thrombin, and ATP as the receptors (FcɛRI, proteinase-activated receptor-1 (PAR-1), and purinergic receptors, respectively) responding to each stimulus utilize a different functional coupling mechanism; namely, nonreceptor tyrosine kinases (24), the Gi subclass (25), and the Gq subclass (26) of heterotrimeric GTP binding proteins, respectively. As shown in Fig. 1 , all three stimuli were capable of inducing degranulation. Additionally, all three stimuli induced the same cytokine mRNA profile (Table I). However, ATP showed a tendency to induce a stronger degranulation and cytokine response than IgE/Ag whereas thrombin was only able to induce between 20 to 33% of the IgE/Ag or ATP responses. Notable exceptions were found in IL-2 and the chemokines, MIP-1β, MIP-1α, M-CSF, and MCP-1, where thrombin stimulation elicited ∼50% of the response obtained with IgE/Ag. These initial experiments provided evidence of the potential for mast cells to express similar cytokine profiles to diverse stimuli, but also suggested that differential sensitivity of certain genes to a stimulus could influence the cytokine profile.
Figure 1.

Mast cell degranulation is differentially induced by IgE/Ag, thrombin, and ATP. BMMCs were stimulated with the indicated concentrations of Ag, thrombin, or ATP for 60 min at 37°C. Hexosamindase release was measured as described (reference 18) and reported as the percent of the total cellular amount. Data is the average of four experiments with standard deviation.
Table I.
Stimulated BMMC Lymphokine mRNA Response (% of Resting Levels ± SEM)
| RPA
|
RT-PCR
|
||||||
|---|---|---|---|---|---|---|---|
| Gene | DNP | Thrombin | ATP | DNP | Thrombin | ATP | na |
| IL-1α | ndb | nd | nd | ntc | nt | nt | 2, 0 |
| IL-1β | 460 ± 35 | 130 ± 12 | 996 ± 46 | nt | nt | nt | 2, 0 |
| IL-1R | nd | nd | nd | nt | nt | nt | 2, 0 |
| IL-2 | nd | nd | nd | 1,732 ± 120 | 1,400 ± 136 | 2,500 ± 219 | 1, 3 |
| IL-3 | nd | nd | nd | 776 ± 128 | 125 ± 16 | 929 ± 115 | 1, 3 |
| IL-4 | nd | nd | nd | 1,760 ± 217 | 218 ± 74 | 3,280 ± 195 | 1, 3 |
| IL-5 | nd | nd | nd | nt | nt | nt | 1, 0 |
| IL-6 | 1,636 ± 162 | 322 ± 93 | 2,248 ± 131 | 1,589 ± 216 | 398 ± 91 | 2,179 ± 154 | 2, 2 |
| IL-7 | nd | nd | nd | nt | nt | nt | 1, 0 |
| IL-9 | nd | nd | nd | nt | nt | nt | 1, 0 |
| IL-10 | nd | nd | nd | 738 ± 214 | 198 ± 22 | 917 ± 254 | 2, 3 |
| IL-11 | nd | nd | nd | nt | nt | nt | 2, 0 |
| IL-12 p35 | nd | nd | nd | nt | nt | nt | 2, 0 |
| IL-12 p40 | nd | nd | nd | nt | nt | nt | 2, 0 |
| IL-13 | 1,239 ± 265 | 150 ± 23 | 2,569 ± 194 | nt | nt | nt | 3, 0 |
| IL-15 | nd | nd | nd | nt | nt | nt | 2, 0 |
| IL-18 | nd | nd | nd | nt | nt | nt | 2, 0 |
| IFN-γ | nd | nd | nd | 750 ± 136 | 182 ± 16 | 1,200 ± 176 | 2, 3 |
| IFN-β | nd | nd | nd | nt | nt | nt | 2, 0 |
| MIF | 120 ± 29 | 100 ± 23 | 435 ± 49 | nt | nt | nt | 3, 0 |
| TNFα | 1,065 ± 168 | 220 ± 31 | 2,225 ± 241 | 987 ± 165 | 200 ± 29 | 2,161 ± 264 | 3, 3 |
| TNFβ | nd | nd | nd | nt | nt | nt | 2, 0 |
| Ltb | nd | nd | nd | nt | nt | nt | 2, 0 |
| TGFβ1 | nd | nd | nd | nt | nt | nt | 2, 0 |
| TGFβ2 | 350 ± 106 | 114 ± 8 | 810 ± 103 | nt | nt | nt | 2, 0 |
| TGFβ3 | nd | nd | nd | nt | nt | nt | 2, 0 |
| GM-CSF | nd | nd | nd | nt | nt | nt | 2, 0 |
| M-CSF | 720 ± 109 | 670 ± 83 | 1,150 ± 179 | nt | nt | nt | 3, 0 |
| G-CSF | nd | nd | nd | nt | nt | nt | 2, 0 |
| LIF | 1,118 ± 206 | 207 ± 28 | 1,886 ± 103 | nt | nt | nt | 3, 0 |
| SCF | nd | nd | nd | nt | nt | nt | 2, 0 |
| Ltn | nd | nd | nd | nt | nt | nt | 2, 0 |
| Rantes | nd | nd | nd | nt | nt | nt | 2, 0 |
| Eotaxin | nd | nd | nd | tn | nt | nt | 2, 0 |
| MIP-1α | 906 ± 218 | 563 ± 149 | 1,578 ± 189 | nt | nt | nt | 3, 0 |
| MIP-1β | 1,724 ± 297 | 869 ± 201 | 2,100 ± 297 | nt | nt | nt | 3, 0 |
| MIP-2 | 724 ± 297 | 382 ± 71 | 1,079 ± 128 | nt | nt | nt | 3, 0 |
| MCP-1 | 1,245 ± 183 | 796 ± 108 | 1,689 ± 219 | 1,197 ± 172 | 975 ± 171 | 1,956 ± 347 | 3, 3 |
| TCA-3 | nd | nd | nd | nt | nt | nt | 2, 0 |
| L32 | 100 | 100 | 100 | nt | nt | nt | 3, 0 |
| GAPDH | 100 | 100 | 100 | 100 | 100 | 100 | 3, 3 |
Selective IgE-mediated Induction of Mast Cell Cytokine mRNA Occurs in Response to Varying Concentrations of Ag.
To test whether the strength of a stimulus affected the cytokine mRNA profile we focused solely on IgE/Ag-mediated responses because this system was readily amenable to manipulation of the number of receptor aggregates by varying the concentration of Ag or the amount of IgE-occupied FcɛRI. As shown in Fig. 2 A, synthesis of IFN-γ, TNF-α, IL-2, IL-3, IL-4, IL-6, IL-10, IL-13, M-CSF, LIF, MIP-1α, MIP-1β, MIP-2, and MCP-1 was detected by RPA or by RT-PCR. Quantitation of the net response to varying concentrations of Ag revealed that the mRNA acummulation of MIP-1α, MIP-1β, MCP-1, M-CSF, IL-2, and IL-4 reached a maximum at significantly lower concentrations of Ag than IL-3, IL-6, IL-10, LIF, MIP-2, TNF-α, and IFN-γ (Fig. 2, B and C). Quantitative analysis of the effective concentration of Ag required for 50% of the maximal response (EC50), summarized in Table II, showed that genes, like MIP-1α and β, were extremely sensitive to small amounts of Ag whereas others, like IL-3 and IL-10, required almost 10-fold higher concentrations to reach their EC50. Interestingly, some chemokine and cytokine mRNA responses reached their EC50 at concentrations of Ag that elicited minimal degranulation (Fig. 1). This suggested that aggregation of small numbers of receptors was sufficient to induce increased mRNA levels of most tested chemokines and some cytokines in the absence of substantial degranulation.
Figure 2.


The antigen concentration determines the profile of lymphokine mRNA induced in activated BMMCs. IgE–sensitized cells were stimulated with different amounts (ng/ml) of DNP-HSA (Ag). Hexosaminidase release was determined (Fig. 1). Total RNA was extracted for RPA and RT-PCR. (A) A representative RPA and RT-PCR experiment showing the Ag concentration-dependent response of the indicated lymphokines and the controls L32 and GAPDH. (B and C) Densitometric quantitation of the increase in mRNA response to varying concentrations of Ag (as a percent of the maximal response observed). The shown curves are representative of the response observed for each apparent group. IFN-γ did not fit in any group. Data shown is the mean of at least three individual experiments for each lymphokine with standard errors.
Table II.
Half-maximal (EC50) Lymphokine mRNA Response of BMMCs to Ag
The Level of Receptor Occupancy with IgE/Ag Causes Differential Expression of Cytokines and Chemokines.
It has been suggested that atopic individuals may differ in their symptoms because the amounts of allergen-specific IgE produced, and thus receptor occupancy, may differ (27, 28). To test this hypothesis cells were loaded with [125I]-labeled DNP-specific mouse IgE at varying ratios in order to obtain a known occupancy of receptors. Fig. 3 A shows that degranulation is relatively linear with increasing receptor occupancy, thus, half maximal degranulation is reached when ∼50% of the receptors are occupied. In contrast, ∼50% of the maximal mRNA accumulation for MCP-1, M-CSF, and IL-4 was observed with ∼10% of the receptors occupied by IgE/Ag (Fig. 3, B and C). 50% of the maximal mRNA response for MIP-1α, MIP-1β, and MIP-2, required between 30–40% IgE receptor occupancy. IL-2, IL-6, IL-13, TNF-α, and LIF required greater than 40% IgE receptor occupancy and IL-10 showed a half-maximal response only when receptor occupancy was greater than 60%.
Figure 3.

Effect of receptor occupancy on degranulation, lymphokine mRNA production, and monocyte/macrophage chemotaxis. (A) BMMCs with varying receptor occupancy (with IgE) were stimulated with Ag (10 ng/ml) and hexosaminidase release was measured (reference 18). Fit has a R2 value of 0.9275, with a slope of 0.9792 to 1.256 within the 95% confidence interval. (B and C) The RNA from the experiments shown in panel A was analyzed by RPA and RT-PCR. mRNA induction of cytokines and chemokines was quantitated by densitometry and expressed as a percent of the maximal mRNA increase for each lymphokine. Curves shown are representative of the distinct mRNA responses observed. (D) The medium from Ag-stimulated BMMCs having low (17.0% ± 1.5) or high receptor occupancy (100.0%) with IgE was collected at the indicated times after Ag stimulation. Chemotaxis of the monocyte/macrophage cell line J774.1 induced by the collected medium was measured using a Boyden chamber assay. MCP-1 (1 or 4 ng/106 cells) was added for 4 h as a positive control. Five randomly selected high power fields were counted per filter. Data shown is the net average of two experiments with triplicate samples. Migration toward medium from unstimulated cells (41 ± 7 cells per field) is subtracted.
We tested if extracellular secretion of lymphokines could occur under conditions of low receptor occupancy. For most lymphokines, 5 h of stimulation was sufficient to reach maximal secretion. When 10% of FcɛRI was occupied by IgE/Ag MCP-1 was potently secreted, with 2076.5 pg/106cells detected in the medium (Table III). This represented ∼42.9% of the secretion observed at 100% occupancy. IL-6, MIP-1β, MIP-1α, and TNF-α were also secreted at amounts that were 10.9%, 48.8%, 48.0%, and 34.1% of the maximal secretion, respectively (Table III). The secreted lymphokines induced a potent monocyte/macrophage (J774.1 cells) chemotactic response that was similar to that observed at full receptor occupancy (Fig. 3 D). MCP-1 alone, at concentrations similar to those secreted (1,000–4,000 pg/106 cells), caused a comparable chemotatic response. IL-4 and IL-10 were not detected at 5 h after stimulation but small amounts were detected after 24 h of stimulation. Under low receptor occupancy only IL-4 was detected whereas IL-10 was not (Table III). Quantitation of secreted IL-6 and secreted MCP-1 showed that at low receptor occupancy almost a 10-fold difference in absolute amounts of these lymphokines exists whereas this difference is strikingly narrowed (2.3-fold) at high receptor occupancy. With the exception of TNF-α, the results are consistent with a skewed lymphokine response that favors chemokines at low receptor occupancy. FcɛRI-mediated TNF-α mRNA responses required higher Ag concentrations or receptor occupancy (Figs. 2 and 3), however, substantial secretion of TNF-α, upon a weak stimulus, may result as a consequence of its synthesis and storage in preformed secretory granules (8).
Table III.
BMMC Secretion of Lymphokines at Low and High Receptor Occupancies
IgE/Ag-induced Gene Responses Show Dependence or Early Independence of Receptor Aggregation.
We previously demonstrated that TNF-α, which requires high receptor occupancy for complete induction, was exquisitely sensitive to disaggregation of receptors by a monovalent hapten (29). We reasoned that it was possible that genes that required a larger number of receptor aggregates could be most sensitive to disruption of receptor aggregates and vice versa. As shown in Fig. 4 A, degranulation of mast cells required continued aggregation of receptors for up to 6 min after Ag addition. At 3 min after Ag addition, hapten addition resulted in ∼50% of the normal degranulation response. The inhibitory effect of hapten was mirrored by the addition of ice cold buffer indicating the interruption of an active process.
Figure 4.

Differential requirement for continued IgE receptor aggregation in lymphokine mRNA responses and degranulation. (A) IgE-sensitized cells were stimulated with Ag (10 ng/ml). Receptor aggregation was stopped by addition of monovalent hapten (DNP-lysine) at the indicated times. In parallel, other samples were placed on ice to stop Ag-stimulated degranulation or left at 37°C for 30 min. Hexosaminidase release was determined. Nonlinear regression analysis of the response to hapten and buffer (4°C) showed a best fit with an R2 value of 0.9311. (B, C, and D) RNA was extracted from the cells in panel A and RPA or RT-PCR was performed. Three distinct groups of mRNA responses were found based on nonlinear regression analysis. Responses that rapidly became independent of receptor aggregation (B), responses that were intermediate in their requirement for continued receptor aggregation (C), and responses that required prolonged receptor aggregation (C). The latter group showed a poor fit (R2) in a nonlinear regression analysis. Data shown is the mean of a minimum of three individual experiments with standard error.
Analysis of the sensitivity of the cytokine and chemokine mRNA response to hapten revealed three distinct responses: first, mRNA accumulation of MIP-1α, MIP-1β, MCP-1, and M-CSF became rapidly independent (between 1–4 min after Ag stimulation) of continued receptor aggregation (Fig. 4 B). Second, mRNA accumulation of LIF, IL-3, IL-4, IL-6, and IL-10 became independent of continued receptor aggregation between 4 and 8 min after Ag stimulation (Fig. 4 C). Third, mRNA accumulation of IL-2, IL-13, IFN-γ, and TNF-α required more than 15 min to show considerable independence of receptor aggregation (Fig. 4 D). Non-linear regression analysis of the mRNA response of IL-2, IL-13, IFN-γ, and TNF-α showed two distinct groups (IL-2, IFN-γ and IL-13, TNF-α). However, the cytokines in each group showed a poor fit suggesting additional regulatory complexity in their response. With some notable exceptions, like IL-2, most mRNA responses induced at low Ag concentrations or low receptor occupancy became rapidly independent of continued receptor aggregation. Vice versa, those genes requiring high Ag concentrations or high receptor occupancy for induction were more dependent on continued receptor aggregation. Despite the noted exception, this suggests that most genes the respond to low Ag or low receptor occupancy conditions can generate intermediates that rapidly become independent of continued receptor aggregation.
Low Ag or Low Receptor Occupancy Favors Fyn/Gab2-initiated Signals and Activation of p38MAPK.
Fyn and Lyn kinases are FcɛRI-proximal Src family kinases that propagate signals through the adapters Gab2 and LAT, respectively (30, 31). Gab2 is required for the activation of PI3K and Akt in mast cells whereas LAT is essential for calcium responses (30, 32). We now tested if low Ag concentrations or low receptor occupancy could induce the phosphorylation of the adapters Gab2 or LAT and other proteins downstream of these adapters. As shown in the upper panel of Fig. 5 A, low Ag concentrations were substantially effective in stimulating the phosphorylation of Fyn, Gab2, and the p85subunit of PI3K. Because the available antibodies to Gab2 are of relatively low affinity, phosphorylated Gab2 was difficult to detect below stimulation with 1 ng/ml of Ag. LAT phosphorylation was detected at 10 ng/ml of Ag. Low receptor occupancy also showed a preference for the Gab2/PI3K pathway as the downstream kinase, Akt, was phosphorylated to ∼80% of that seen at high receptor occupancy (Fig. 5 A, bottom panel). In contrast, ERK2 phosphorylation, which depends primarily on LAT (18), was at best 15% of that seen at high receptor occupancy when films were overexposed. This suggested that the Gab2/PI3K pathway was more sensitive in its response to low Ag or low receptor occupancy. Given our previous finding of a potent MCP-1 response under conditions of low Ag concentrations or low receptor occupancy, this suggested that Gab2 might be more important to MCP-1 mRNA responses than LAT. As shown in Fig. 5 B, Gab2-deficient mast cells were defective in the mRNA response of all the tested chemokines whereas cytokine mRNA responses were less severely affected. Strikingly, LAT-deficient mast cells showed the opposite profile with cytokines being more severely inhibited than chemokines. In Gab2-deficient mast cells, the inhibition of chemokine mRNA responses ranged from 65–90% depending on receptor occupancy. Gab2 deficiency also caused a 10–30% inhibition of cytokine mRNA responses. In contrast, LAT-deficient mast cells showed an inhibition of chemokine mRNA responses that ranged from 15–40% with MCP-1 and LIF mRNA responses being unaffected. Cytokine mRNA responses were more severely affected by LAT-deficiency with inhibition ranging from 40–80%.
Figure 5.
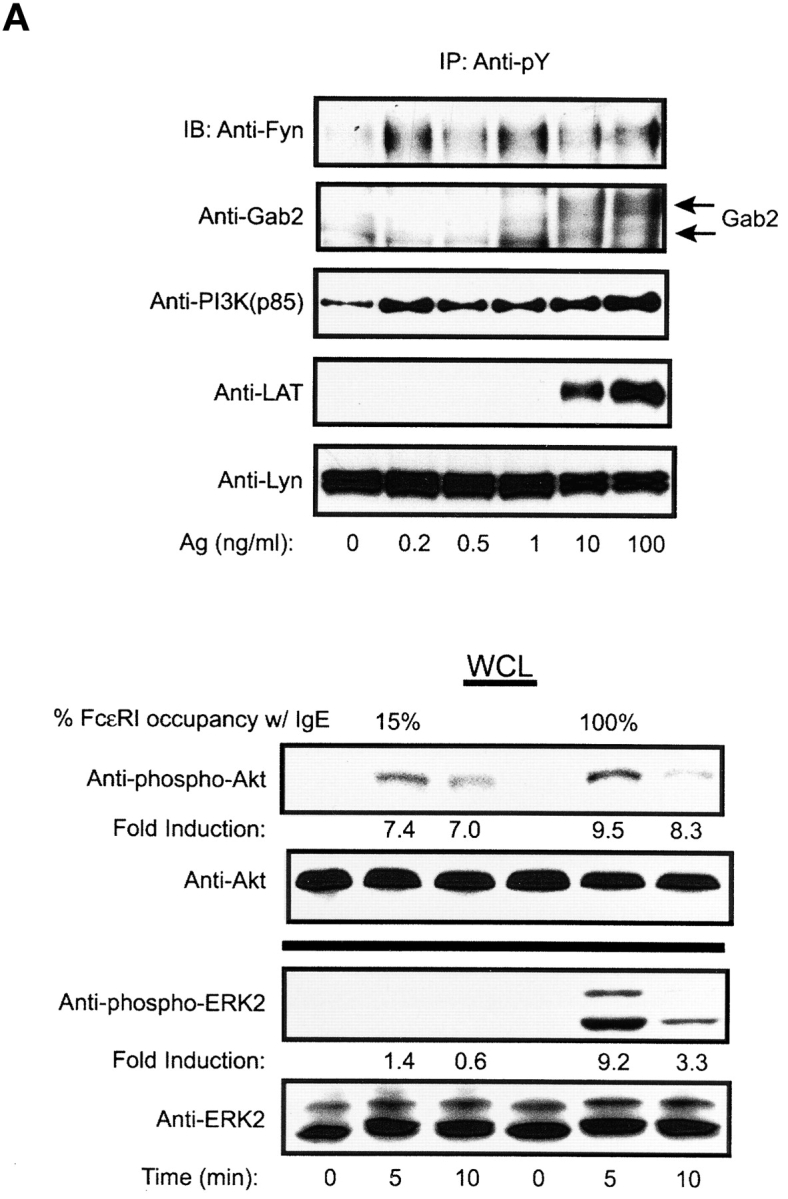

Low Ag concentration or low receptor occupancy causes preferential induction of Fyn/Gab2/PI3K/Akt phosphorylation and Gab2- or LAT-deficiency preferentially inhibits chemokine or cytokine mRNA responses, respectively. (A) IgE-sensitized BMMCs were stimulated for 3 min with the indicated concentrations of Ag. Phosphoproteins were immunoprecipitated with anti-phosphotyrosine (Anti-pY) and immunoblots were probed with the indicated antibodies. (Bottom panel) BMMCs sensitized with IgE at 15% or 100% receptor occupancy were stimulated with Ag (10 ng/ml) for the indicated time. Phosphorylation of Akt and ERK2 was determined with phospho-specific antibodies. Protein levels were determined by reprobing of immunoblots with anti-Akt or anti-ERK2. One representative of four experiments is shown. Fold induction is the average from four experiments. (B) BMMCs from Gab2-deficient or LAT-deficient mice were sensitized as in panel A, bottom panel, to obtain the indicated occupancy of receptors with IgE. Cells were stimulated with Ag (10 ng/ml) for 1 h and RNA was extracted. One representative RPA experiment of four for Gab2 and two for LAT is shown. Exposure shown is where all responses observed were in the linear range of detection. Overexposure showed significant induction of chemokines at 5% occupancy for the Gab2 analysis.
To gain a further understanding of the influence of receptor occupancy on gene expression we explored the activation (phosphorylation) of MAP kinases. Fig. 6 A demonstrates that p38MAPK was most sensitive to low receptor occupancy with 50% of the maximal phosphorylation detected at ∼12% receptor occupancy. In contrast, ERK2 required more than 25% and JNK1 more than 40% occupancy to reach 50% of their maximal phosphorylation levels. It should be noted that consistent with greater sensitivity of Gab2 to weak stimulation, a previous report demonstrated impaired p38MAPK activation in Gab2-deficient mast cells (32). We postulated that if p38MAPK activation is required for production of lymphokines that respond under weak stimulation, like MCP-1, its activation should become rapidly independent of continued receptor aggregation (like MCP-1). Fig. 6 B shows that p38MAPK becomes rapidly independent of continued receptor aggregation (1 min). The activation of both JNK and ERK2 showed a greater dependence on continued receptor aggregation with independence being achieved after 3 and 8 min post-Ag stimulation, respectively (graph, Fig. 6 B). Together, with prior results on chemokine responses, these findings demonstrate a relationship between sensitivity to a weak stimulus and rapid independence of continued receptor aggregation. They also provide suggestive evidence for the importance of p38MAPK in the mRNA responses (like MCP-1) induced by low Ag concentration or low receptor occupancy.
Figure 6.
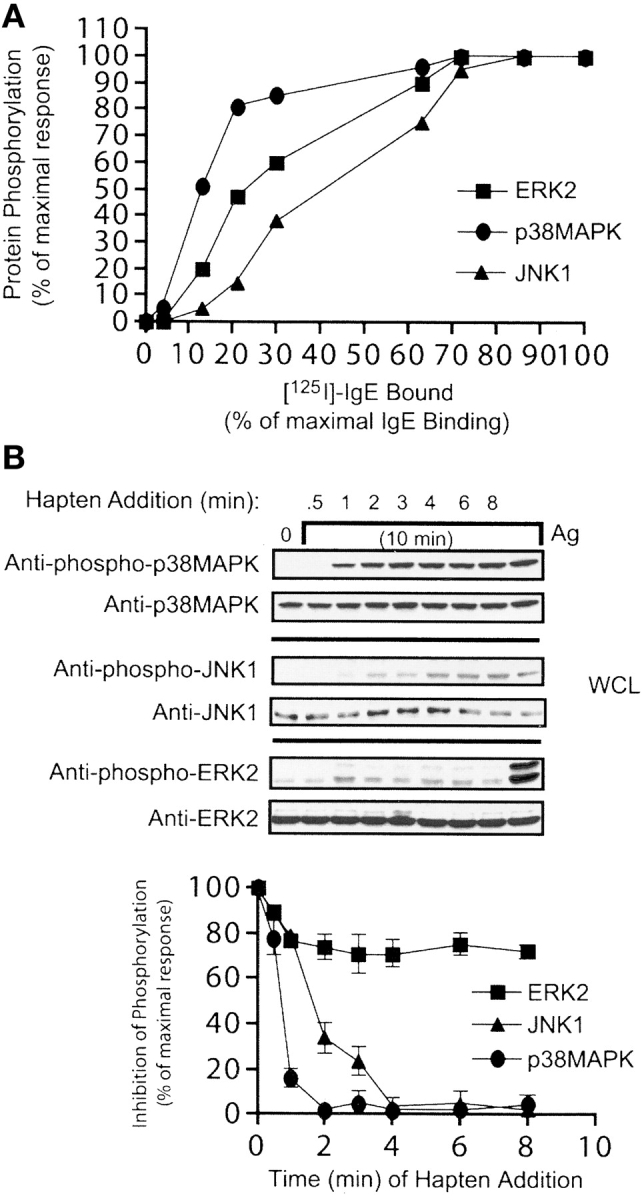
Sensitivity of MAP kinase activation to receptor occupancy and continued receptor aggregation. (A) BMMC were sensitized at varying densities of receptor occupancy with IgE and stimulated with Ag (100 ng/ml) for 10 min. Phosphorylation of p38MAPK, JNK1, and ERK2 was measured using phosphospecific antibodies. Quantitation of phosphorylation was by densitometry and is expressed as a percent of the maximal phosphorylation observed at 100% receptor occupancy. Data is from two individual experiments. (B) BMMCs were sensitized with IgE at 100% receptor occupancy and stimulated as in panel A. The monovalent hapten (DNP-lysine) was added at the indicated times after Ag stimulation. Phosphorylation of p38MAPK, JNK1, and ERK2 was measured using phosphospecific antibodies. One representative experiment is shown. Graph shows the average of densitometric quantitation of three experiments expressed as % inhibition of the response in absence of hapten.
MCP-1 and TNF-α Genes Show Preferential Requirement for p38MAPK or ERK2, Respectively.
While it is well understood that multiple pathways cooperate with the activity of MAP kinases in gene expression (33, 34), we tested whether the mRNA accumulation of some cytokines and chemokines showed preferential sensitivity to inhibition of p38MAPK and ERK2 by SB202190 and PD98059, respectively. We chose to analyze the sensitivity of two genes that well-represent mRNA induction by low IgE/Ag receptor occupancy (MCP-1) or high IgE/Ag receptor occupancy (TNF-α; see Fig. 3, B and C). Fig. 7 shows that pretreatment of BMMC with PD98059 inhibited TNF-α mRNA accumulation by 70%, whereas SB 202190 inhibited TNF-α mRNA accumulation by ∼30%. In contrast, SB202190 inhibited MCP-1 mRNA accumulation by almost 80% whereas PD98059 had no effect on the mRNA accumulation of this chemokine. However, another analyzed gene, IL-13, which responded to intermediate Ag concentrations or receptor occupancy, was not as effectively inhibited (∼23–38%) by SB202190 or PD98059. The findings are consistent with induction of p38MAPK and ERK2 at low or high IgE/Ag receptor occupancy as important in MCP-1 and TNF-α mRNA responses, respectively.
Figure 7.

Treatment of BMMCs with the MAP kinase inhibitors, SB202190 and PD98058, shows the preferential requirement of p38MAPK and ERK2 for induction of MCP-1 and TNF-α, respectively. IgE-sensitized BMMCs were preincubated for 15 min at 37°C with 5 μM of the p38 MAPK inhibitor SB202190 or 10 μM of the ERK2 upstream kinase, MEK1, inhibitor PD98058. Control cells were preincubated in the absence of inhibitors. Cells were activated or not with Ag (100 ng/ml) and RNA was extracted and RPA was performed. Quantitation of RPA films was by densitometry and is expressed as a percent of the maximal response observed in the absence of inhibitors.
Discussion
Herein, we describe that weak FcɛRI stimulation of mast cells causes preferential cell signaling and a lymphokine response that shows potent chemokine production. Our findings demonstrate that a homogeneous population of mast cells can respond differently to the same allergen depending on its concentration or on the extent of receptor occupancy (number of receptor aggregates), or the persistence of the allergen (continued receptor aggregation).
Recently, there is increased awareness of the importance of the stability or life span of a receptor in an aggregate complex. It is thought that the life span of an activated receptor in a receptor aggregate is important for the generation of signals that lead to “productive” cellular responses (35–38). One well studied system is the TCR, where studies demonstrate that the strength of the signal can cause different cellular responses. Thus, weak TCR stimulation induces a calcium signal that is sufficient to trigger IL-4 synthesis whereas stronger TCR stimulation induces MAP kinase activation that controls IFN-γ production (37). Other studies show that the pattern of signaling events induced by stimulation of the TCR with low doses of peptides, by a partial agonists, or by CD28 costimulation can cause differential responses or anergy (39–41), and even determine Th1 or Th2 differentiation (42). Physiological concentrations of the B7 ligand, that stimulates CD28 on T cells, causes preferential activation of a subset of the signaling molecules observed when T cells are activated by antibody to CD3 or by antibody costimulation of the TCR and CD28 (42, 43). Hence, the view arising from these studies is that the overall potency of the stimulus is critical in determining what signals are generated and what cellular outcomes are observed.
T.W. McKeithan introduced a “kinetic proofreading” model to explain the ability of the TCR to discriminate between different ligands that might bind the same receptor but elicit different cellular outcomes (44). Central to this tenet is that the initiating ligand–receptor interaction be maintained for sufficient time to allow the occurrence of the required series of events leading to a particular cellular response. Torigoe and colleagues demonstrated that the FcɛRI is also under the constraints of “kinetic proofreading” (36). Using a low affinity ligand and conditions where receptor phosphorylation was similar to that produced by a high affinity ligand, the phosphorylation of the downstream effectors, Syk, Nck, ERK2, as well as mast cell degranulation was progressively diminished. This suggested that the low affinity ligand failed to maintain an interaction with the receptor for sufficient time to generate the required intermediate states leading to mast cell degranulation (36). However, later observations showed that MCP-1 production occurred with a low affinity ligand, suggesting that some signaling intermediates can become independent of the kinetic proofreading requirement (45). With some exceptions (as noted below), we found that genes induced by low Ag or low receptor occupancy are regulated by intermediates that rapidly become independent of the need for continued ligand:receptor interactions. In contrast, genes requiring high Ag or high receptor occupancy were more dependent on continued ligand:receptor interactions suggesting that the generation of appropriate intermediates required sustained interactions. It should be noted that IL-2 and IL-10 mRNA responses were an exception to this generalization. However, in T cells these genes show exquisitely complex transcriptional and posttranscriptional regulation that may differ based on the strength or the type of stimulus (46, 47).
The finding that some signals are more sensitive to a weak stimulus is an important addition to our understanding of FcɛRI function. The stronger induction of certain lymphokines has significant physiological implications (discussed below). However, the findings also demonstrate that the recently described Fyn-initiated signaling pathway that uses the adaptor Gab2 (30, 32) is seemingly more sensitive to a weak stimulus than the adaptor LAT. However, a weak stimulus is also likely to make LAT partly functional since ERK2 activation (at 15% of levels seen with a strong stimulus) can be detected and overexposure of immunoblots showed a weak LAT phosphorylation (unpublished data). A weak stimulus might also serve to prime the cells signaling apparatus to a subsequent challenge, as anergic T cells showed a lowered activation threshold for induction of CD25 and CD69 in response to an antigenic stimulus (48). The finding that FcɛRI can differentially activate MAP kinases, depending on stimulus strength, is supported by studies showing the rapid induction of p38MAPK activity in mast cells and basophils (49) and the requirement for minimal activation of p38MAPK for increased cyclooxygenase-2 expression in RBL cells (50). Because Gab2 was shown to be upstream of p38MAPK (32) these findings support the notion that a weak stimulus more strongly activates signals associated with the Gab2 than those associated with LAT. Gab2 was shown (51) to reside in membrane domains that exclude LAT but contain FcɛRI. Hence, preferential signaling may also reflect the kinetics of FcɛRI coupling to Gab2 as preceding the coupling to LAT. However, it should be noted that weak signals in the LAT pathway are apparent under a weak stimulus and the relative contribution of LAT to production of chemokines like MIP-1α and MIP-1β is still significant (Fig. 5 B).
It was recently recognized that chemokines and chemokine receptors play an important role in allergic airway disease (52, 53) and antichemokine therapy represents a new and promising approach to allergy immunotherapy (54). The expression of the chemokine MCP-1, during cutaneous allergic reactions, is mast cell dependent and primarily responsible for the influx of monocytes to the reaction sites (55). Moreover, the selective production of chemokines in the absence of mast cell degranulation was reported in response to Dengue virus infection (56). We now demonstrate that conditions of low occupancy by IgE or low Ag induces a potent production of chemokines, like MCP-1 and MIP-1β, that can recruit macrophages, monocytes, and other leukocytes. Importantly, this occurs in the absence of considerable mast cell degranulation and of immunoregulatory cytokines, like IL-10, which down-regulate the Th2 response. Our findings suggest that a weak allergen or a small number of receptors occupied with an allergen-specific IgE can elicit mast cell–mediated inflammation and is consistent with the idea that production of chemokines is central to the allergic inflammation. This defines a previously unrecognized plasticity in mast cell responses that is likely to be an important component of a mast cells function in health and disease.
Acknowledgments
We thank Dr. Michael A. Beaven (NHLBI, NIH) for critical review of the manuscript, Dr. Howard A. Young (NCI, NIH) for advice on RNAse Protection Assays, and Dr. Adolfo Garcia Sainz (IFC, UNAM, Mexico) for providing reagents and equipment for this work.
The work of the Molecular Inflammation Section was supported by the Intramural Research Program of the National Institute of Arthritis and Musculoskeletal and Skin Diseases, by the United States-Israel Binational Science Foundation grant no. 2000016, and by a Pan-American Fellowship Award to C. Gonzalez-Espinosa from CONACyT (Mexico) and Fogarty International Center (NIH). C. Gonzalez-Espinosa is currently supported by grant no. 39726-Q from CONACyT.
Footnotes
*
Abbreviations used in this paper: BMMC, bone marrow–derived mast cell; MCP-1, monocyte chemoattractant protein 1; MIP1α, macrophage inflammatory protein 1α; RPA, ribonuclease protection assay.
References
- 1.Wedemeyer, J., M. Tsai, and S.J. Galli. 2000. Role of mast cells and basophils in innate and acquired immunity. Curr. Opin. Immunol. 12:624–631. [DOI] [PubMed] [Google Scholar]
- 2.Gurish, M.F., and K.F. Austen. 2001. The diverse roles of mast cells. J. Exp. Med. 194:F1–F5. [DOI] [PMC free article] [PubMed] [Google Scholar]
- 3.Costa, J.J., P.F. Weller, and S.J. Galli. 1997. The cells of the allergic response - mast cells, basophils, and eosinophils. JAMA. 278:1815–1822. [PubMed] [Google Scholar]
- 4.Kinet, J.P. 1999. The high-affinity IgE receptor (FcɛRI): From physiology to pathology. Annu. Rev. Immunol. 17:931–972. [DOI] [PubMed] [Google Scholar]
- 5.Burd, P.R., H.W. Rogers, J. Sundararajan, S.D. Wilson, A.M. Dvorak, S.J. Galli, and M.E. Dorf. 1989. Interleukin 3-dependent and -independent mast cells stimulated with IgE and antigen express multiple cytokines. J. Exp. Med. 170:245–257. [DOI] [PMC free article] [PubMed] [Google Scholar]
- 6.Gordon, J.R. 1997. FcɛRI-induced cytokine production and gene expression. IgE Receptor (FcɛRI) Function in Mast Cells and Basophils. M.M. Hamawy, editor. R.G. Landes Company, Austin, TX. 209–242.
- 7.Plaut, M., J.H. Pierce, C.J. Watson, J. Hanley-Hyde, R.P. Nordan, and W.E. Paul. 1989. Mast cell lines produce lymphokines in response to cross-linkage of FcɛRI or to calcium ionophores. Nature. 339:64–67. [DOI] [PubMed] [Google Scholar]
- 8.Gordon, J.R., and S.J. Galli. 1990. Mast cells as a source of both preformed and immunologically-inducible tumor necrosis factor-alpha. Nature. 346:274–276. [DOI] [PubMed] [Google Scholar]
- 9.Gordon, J.R., and S.J. Galli. 1994. Promotion of mouse fibroblast collagen gene expression by mast cells stimulated via the FcɛRI. Role of mast cell-derived transforming growth factor and tumor necrosis factor alpha. J. Exp. Med. 180:2027–2037. [DOI] [PMC free article] [PubMed] [Google Scholar]
- 10.Leal-Berumen, I., P. Conlon, and J.S. Marshall. 1994. IL-6 production by rat peritoneal mast cells is not necessarily preceded by histamine release and can be induced by bacterial lipopolysaccharide. J. Immunol. 152:5468–5476. [PubMed] [Google Scholar]
- 11.Bissonnette, E., and A.D. Befus. 1990. Interferon gamma can supress IgE-mediated TNF release from rat peritoneal mast cells. J. Immunol. 145:3385–3393. [PubMed] [Google Scholar]
- 12.Smith, T.J., L.A. Ducharme, and J.H. Weis. 1994. Preferential expression of IL-12 or IL-4 by murine bone marrow mast cells derived in mast cell growth factor or IL-3. Eur. J. Immunol. 24:822–826. [DOI] [PubMed] [Google Scholar]
- 13.Bradding, P., I.H. Feather, S. Wilson, P.G. Bardin, C.H. Heusser, S.T. Holgate, and P.H. Howarth. 1993. Immunolocalization of cytokines in the nasal mucosa of normal and perennial rhinitic subjects. The mast cell as a source of IL-4, IL-5, and IL-6 in human allergic mucosal inflammation. J. Immunol. 151:3853–3865. [PubMed] [Google Scholar]
- 14.Bradding, P., Y. Okayama, P. Howarth, M.K. Church, and S.T. Holgate. 1995. Heterogeneity of human mast cells based on cytokine content. J. Immunol. 155:297–307. [PubMed] [Google Scholar]
- 15.Liu, F.T., J.W. Bohn, E.L. Ferry, H. Yamamoto, C.A. Molinaro, L.A. Sherman, N.R. Klinman, and D.H. Katz. 1980. Monoclonal dinitrophenyl-specific murine IgE antibody: preparation, isolation, and characterization. J. Immunol. 124:2728–2737. [PubMed] [Google Scholar]
- 16.Kulczycki, A., Jr., and H. Metzger. 1974. The interaction of IgE with rat basophilic leukemia cells. II Quantitative aspects of the binding reaction. J. Exp. Med. 140:1676–1695. [DOI] [PMC free article] [PubMed] [Google Scholar]
- 17.Razin, E. 1990. Culture of bone marrow-derived mast cells: a model for studying oxidative metabolism of arachidonic acid and synthesis of other molecules derived from membrane phospholipids. Methods Enzymol. 187:514–520. [DOI] [PubMed] [Google Scholar]
- 18.Saitoh, S., R. Arudchandran, T.S. Manetz, W. Zhang, C.L. Sommers, P.E. Love, J. Rivera, and L.E. Samelson. 2000. LAT is essential for Fc(epsilon)RI-mediated mast cell activation. Immunity. 12:525–535. [DOI] [PubMed] [Google Scholar]
- 19.Finbloom, D.S., and H. Metzger. 1982. Binding of immunoglobulin E to the receptor on rat peritoneal macrophages. J. Immunol. 129:2004–2008. [PubMed] [Google Scholar]
- 20.Song, J.S., J. Gomez, L.F. Stancato, and J. Rivera. 1996. Association of a p95 Vav-containing signaling complex with the FcɛRI gamma chain in the RBL-2H3 mast cell line - Evidence for a constitutive in vivo association of Vav with Grb2, Raf-1, and ERK2 in an active complex. J. Biol. Chem. 271:26962–26970. [DOI] [PubMed] [Google Scholar]
- 21.Arudchandran, R., M.J. Brown, M.J. Peirce, J.S. Song, J. Zhang, R.P. Siraganian, U. Blank, and J. Rivera. 2000. The Src homology 2 domain of Vav is required for its compartmentation to the plasma membrane and activation of c-jun NH(2)-terminal kinase 1. J. Exp. Med. 191:47–60. [DOI] [PMC free article] [PubMed] [Google Scholar]
- 22.Wang, F., J.R. Van Brocklyn, J.P. Hobson, S. Movafagh, Z. Zukowska-Grojec, S. Milstien, and S. Spiegel. 1999. Sphingosine 1-phosphate stimulates cell migration through a G(i)-coupled cell surface receptor. J. Biol. Chem. 274:35343–35350. [DOI] [PubMed] [Google Scholar]
- 23.Baghestanian, M., R. Hofbauer, H.P. Kiener, H.C. Bankl, F. Wimazal, M. Willheim, O. Scheiner, W. Fureder, M.R. Muller, D. Bevec, et al. 1997. The c-kit ligand stem cell factor and anti-IgE promote expression of monocyte chemoattractant protein-1 in human lung mast cells. Blood. 90:4438–4449. [PubMed] [Google Scholar]
- 24.Eiseman, E., and J.B. Bolen. 1992. Engagement of the high-affinity IgE receptor activates src protein-related tyrosine kinases. Nature. 355:78–80. [DOI] [PubMed] [Google Scholar]
- 25.Ellis, C.A., A.B. Malik, A. Gilchrist, H. Hamm, R. Sandoval, T. Voyno-Yasenetskaya, and C. Tiruppathi. 1999. Thrombin induces proteinase-activated receptor-1 gene expression in endothelial cells via activation of Gi-linked Ras/mitogen-activated protein kinase pathway. J. Biol. Chem. 274:13718–13727. [DOI] [PubMed] [Google Scholar]
- 26.Hoffman, H.M., L.L. Walker, and D.L. Marquardt. 1997. Mast cell adenosine induced calcium mobilization via Gi3 and Gq proteins. Inflammation. 21:55–68. [DOI] [PubMed] [Google Scholar]
- 27.Pene, J., A. Rivier, B. Lagier, W.M. Becker, F.B. Michel, and J. Bousquet. 1994. Differences in IL-4 release by PBMC are related with heterogeneity of atopy. Immunology. 81:58–64. [PMC free article] [PubMed] [Google Scholar]
- 28.Muller, W.D., T. Karamfilov, B. Fahlbusch, H. Vogelsang, and L. Jager. 1994. Analysis of human T cell clones reactive with group V grass pollen allergens. Int. Arch. Allergy Immunol. 105:391–396. [DOI] [PubMed] [Google Scholar]
- 29.Pelletier, C., N. Varin-Blank, J. Rivera, B. Iannascoli, F. Marchand, B. David, A. Weyer, and U. Blank. 1998. FcɛRI-mediated induction of TNF-α gene expression in the RBL-2H3 mast cell line: regulation by a novel NF-κB-like nuclear binding complex. J. Immunol. 161:4768–4776. [PubMed] [Google Scholar]
- 30.Parravicini, V., M. Gadina, M. Kovarova, S. Odom, C. Gonzalez-Espinosa, Y. Furumoto, S. Saitoh, L.E. Samelson, J.J. O'Shea, and J. Rivera. 2002. Fyn kinase initiates complementary signals required for IgE-dependent mast cell degranulation. Nat. Immunol. 3:741–748. [DOI] [PubMed] [Google Scholar]
- 31.Rivera, J. 2002. Molecular adapters in FcɛRI signaling and the allergic response. Curr. Opin. Immunol. 14:688–693. [DOI] [PubMed] [Google Scholar]
- 32.Gu, H., K. Saito, L.D. Klaman, J. Shen, T. Fleming, Y. Wang, J.C. Pratt, G. Lin, B. Lim, J.-P. Kinet, and B.G. Neel. 2001. Essential role for Gab2 in the allergic response. Nature. 412:186–190. [DOI] [PubMed] [Google Scholar]
- 33.Karin, M. 1994. Signal transduction from the cell surface to the nucleus through the phosphorylation of transcription factors. Curr. Opin. Cell Biol. 6:415–424. [DOI] [PubMed] [Google Scholar]
- 34.Davis, R.J. 1995. Transcriptional regulation by MAP kinases. Mol. Reprod. Dev. 42:459–467. [DOI] [PubMed] [Google Scholar]
- 35.Nossal, G.J. 1994. Negative selection of lymphocytes. Cell. 76:229–239. [DOI] [PubMed] [Google Scholar]
- 36.Torigoe, C., J.K. Inman, and H. Metzger. 1998. An unusual mechanism for ligand antagonism. Science. 281:568–572. [DOI] [PubMed] [Google Scholar]
- 37.Badou, A., M. Savignac, M. Moreau, C. Leclerc, G. Foucras, G. Cassar, P. Paulet, D. Lagrange, P. Druet, J.C. Guery, and L. Pelletier. 2001. Weak TCR stimulation induces a calcium signal that triggers IL-4 synthesis, stronger TCR stimulation induces MAP kinases that control IFN-gamma production. Eur. J. Immunol. 31:2487–2496. [DOI] [PubMed] [Google Scholar]
- 38.Freiberg, B.A., H. Kupfer, W. Maslanik, J. Delli, J. Kappler, D.M. Zaller, and A. Kupfer. 2002. Staging and resetting T cell activation in SMACs. Nat. Immunol. 3:911–917. [DOI] [PubMed] [Google Scholar]
- 39.Sloan-Lancaster, J., B.D. Evavold, and P.M. Allen. 1993. Induction of T-cell anergy by altered T-cell-receptor ligand on live antigen-presenting cells. Nature. 363:156–159. [DOI] [PubMed] [Google Scholar]
- 40.Lenschow, D.J., and J.A. Bluestone. 1993. T cell co-stimulation and in vivo tolerance. Curr. Opin. Immunol. 5:747–752. [DOI] [PubMed] [Google Scholar]
- 41.Michel, F., G. Attal-Bonnefoy, G. Mangino, S. Mise-Omata, and O. Acuto. 2001. CD28 as a molecular amplifier extending TCR ligation and signaling capabilities. Immunity. 15:935–945. [DOI] [PubMed] [Google Scholar]
- 42.Boutin, Y., D. Leitenberg, X. Tao, and K. Bottomly. 1997. Distinct biochemical signals characterize agonist- and altered peptide ligand-induced differentiation of naive CD4+ T cells into Th1 and Th2 subsets. J. Immunol. 159:5802–5809. [PubMed] [Google Scholar]
- 43.Michel, F., and O. Acuto. 2002. CD28 costimulation: a source of Vav-1 for TCR signaling with the help of SLP-76. Sci STKE 2002:PE35. [DOI] [PubMed]
- 44.McKeithan, T.W. 1995. Kinetic proofreading in T-cell receptor signal transduction. Proc. Natl. Acad. Sci. USA. 92:5042–5046. [DOI] [PMC free article] [PubMed] [Google Scholar]
- 45.Liu, Z.-J., H. Haleem-Smith, H. Chen, and H. Metzger. 2001. Unexpected signals in a system subject to kinetic proofreading. Proc. Natl. Acad. Sci. USA. 98:7289–7294. [DOI] [PMC free article] [PubMed] [Google Scholar]
- 46.Powell, J.D., J.A. Ragheb, S. Kitagawa-Sakakida, and R.H. Schwartz. 1998. Molecular regulation of interleukin-2 expression by CD28 co-stimulation and anergy. Immunol. Rev. 165:287–300. [DOI] [PubMed] [Google Scholar]
- 47.Naora, H., and I.G. Young. 1995. Comparison of the mechanisms regulating IL-5, IL-4, and three other lymphokine genes in the Th2 clone D10.G4.1. Exp. Hematol. 23:597–602. [PubMed] [Google Scholar]
- 48.Utting, O., S.-J. Teh, and H.-S. Teh. 2000. A population of in vivo anergized T cells with a lower activation threshold for the induction of CD25 exhibit differential requirements in mobilization of intracellular calcium and mitogen-activated protein kinase activation. J. Immunol. 164:2881–2889. [DOI] [PubMed] [Google Scholar]
- 49.Gibbs, B.F., K.E. Plath, H.H. Wolff, and J. Grabbe. 2002. Regulation of mediator secretion in human basophils by p38 mitogen-activated protein kinase: phosphorylation is sensitive to the effects of phophatidylinositol 3-kinase inhibitors and calcium mobilization. J. Leukoc. Biol. 72:391–400. [PubMed] [Google Scholar]
- 50.Hundley, T.R., A.R. Prasad, and M.A. Beaven. 2001. Elevated levels of cyclooxygenase-2 in antigen-stimulated mast cells is associated with minimal activation of p38 mitogen-activated protein kinase. J. Immunol. 167:1629–1636. [DOI] [PubMed] [Google Scholar]
- 51.Wilson, B.S., J.R. Pfeiffer, Z. Surviladze, E.A. Gaudet, and J.M. Oliver. 2001. High resolution mapping of mast cell membranes reveals primary and secondary domains of Fc_RI and LAT. J. Cell Biol. 154:645–658. [DOI] [PMC free article] [PubMed] [Google Scholar]
- 52.Gonzalo, J.A., C.M. Lloyd, D. Wen, J.P. Albar, T.N. Wells, A. Proudfoot, A.C. Martinez, M. Dorf, T. Bjerke, A.J. Coyle, and J.C. Gutierrez-Ramos. 1998. The coordinated action of CC chemokines in the lung orchestrates allergic inflammation and airway hyperresponsiveness. J. Exp. Med. 188:157–167. [DOI] [PMC free article] [PubMed] [Google Scholar]
- 53.Rothenberg, M.E., N. Zimmerman, A. Mishra, E. Brandt, L.A. Birkenberger, S.P. Hogan, and P.S. Foster. 1999. Chemokines and chemokine receptors: their role in allergic airway disease. J. Clin. Immunol. 19:250–265. [DOI] [PubMed] [Google Scholar]
- 54.Luster, A.D. 2001. Antichemokine immunotherapy for allergic disease. Curr. Opin. Allergy Clin. Immunol. 1:561–567. [DOI] [PubMed] [Google Scholar]
- 55.Gordon, J.R. 2000. Monocyte chemoattractant peptide-1 expression during cutaneous allergic reactions in mice is mast cell dependent and largely mediates the monocyte recruitment response. J. Allergy Clin. Immunol. 106:110–116. [DOI] [PubMed] [Google Scholar]
- 56.King, C.A., R. Anderson, and J.S. Marshall. 2002. Dengue virus selectively induces human mast cell chemokine production. J. Virol. 76:8408–8419. [DOI] [PMC free article] [PubMed] [Google Scholar]