Deletion of the mammalian INDY homolog mimics aspects of dietary restriction and protects against adiposity and insulin resistance in mice - PubMed
- ️Sat Jan 01 2011
. 2011 Aug 3;14(2):184-95.
doi: 10.1016/j.cmet.2011.06.009.
Hui-Young Lee, Fitsum Guebre-Egziabher, Tiago C Alves, Michael J Jurczak, Francois R Jornayvaz, Dongyang Zhang, Jennifer J Hsiao, Alejandro Martin-Montalvo, Antje Fischer-Rosinsky, Joachim Spranger, Andreas F Pfeiffer, Jens Jordan, Martin F Fromm, Jörg König, Stefanie Lieske, Christopher M Carmean, David W Frederick, Dirk Weismann, Felix Knauf, Pablo M Irusta, Rafael De Cabo, Stephen L Helfand, Varman T Samuel, Gerald I Shulman
Affiliations
- PMID: 21803289
- PMCID: PMC3163140
- DOI: 10.1016/j.cmet.2011.06.009
Deletion of the mammalian INDY homolog mimics aspects of dietary restriction and protects against adiposity and insulin resistance in mice
Andreas L Birkenfeld et al. Cell Metab. 2011.
Erratum in
- Cell Metab. 2011 Oct 5;14(4):567
Abstract
Reduced expression of the Indy (I'm Not Dead, Yet) gene in D. melanogaster and its homolog in C. elegans prolongs life span and in D. melanogaster augments mitochondrial biogenesis in a manner akin to caloric restriction. However, the cellular mechanism by which Indy does this is unknown. Here, we report on the knockout mouse model of the mammalian Indy (mIndy) homolog, SLC13A5. Deletion of mIndy in mice (mINDY(-/-) mice) reduces hepatocellular ATP/ADP ratio, activates hepatic AMPK, induces PGC-1α, inhibits ACC-2, and reduces SREBP-1c levels. This signaling network promotes hepatic mitochondrial biogenesis, lipid oxidation, and energy expenditure and attenuates hepatic de novo lipogenesis. Together, these traits protect mINDY(-/-) mice from the adiposity and insulin resistance that evolve with high-fat feeding and aging. Our studies demonstrate a profound effect of mIndy on mammalian energy metabolism and suggest that mINDY might be a therapeutic target for the treatment of obesity and type 2 diabetes.
Copyright © 2011 Elsevier Inc. All rights reserved.
Figures
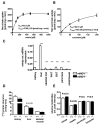
mIndy tissue distribution and functional characteristics. A and B) mINDY transport kinetics for citrate (A) and succinate (B). HEK293 cells were transfected with the plasmids pIndy-mouse.3.1 or empty expression vector pcDNA3.1(+). Uptake assays were performed in HEK-mIndy cells and HEK-Co/418 cells transfected with the empty expression vector pcDNA3.1(+) serving as control cells. Net-uptake is expressed as the difference between the uptake of substrates into HEK-mIndy cells and HEK-Co/418 cells (n=3-6 for each concentration). Km values were determined by fitting the data to a non-linear regression curve fit. C) mIndy mRNA tissue expression in mINDY+/+ and mINDY−/− mice (n=3-4). D) [14C]-citrate clearance in mINDY+/+ and mINDY−/− mice in vivo (n=6). E) Relative mINDY-substrate plasma concentrations. Plasma citrate concentration is increased in the mINDY−/− mice, in which the cellular uptake of citrate is reduced (n=7-8),***P<0.01, all error bars represent SEM, see also Figures S1 and S2
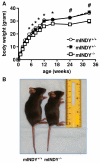
mINDY mice characteristics. A) Time course of body weight over a nine months period (n=9-15). Differences in body weight increase with time. B) Representative photographs of mINDY+/+ and mINDY−/− mice. Body lengths of mINDY+/+ and mINDY−/− mice are given in Supplemental Figure S3. *P<0.05, #P<0.01, all error bars represent SEM, see also Figure S3.
mINDY mice are protected from HFD induced obesity. A) Body weight of mINDY+/+, mINDY+/−and mINDY−/− mice on a 6 week HFD (n=8). B) Whole body fat content and lean body mass after a 6 week HFD in the indicated phenotype, as assessed by 1H magnetic resonance spectroscopy (n=8). Body fat is reduced in HFD fed mINDY−/− mice. C) Plasma β-hydroxybutyrate, a marker of hepatic lipid oxidation, is increased in HFD fed mINDY−/− mice (n=7) D) Lipid oxidation from [1-14C]oleate is increased in primary hepatocytes mINDY−/− mice (n=5). E) State III oxygen consumption in liver homogenate from mINDY−/− mice is increased (n=3). F) Lipid synthesis from [14C]citrate is reduced by ~ 90% in mINDY−/− primary hepatocytes (n=6). *P<0.05, #P<0.01, all error bars represent SEM, see also Figure S4
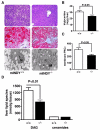
Protection from HFD induced hepatic steatosis. A) Representative H&E stains (top), Oil-Red-O stains (middle) and electron microscopic magnifications of liver samples from 6 week HFD fed mice of the indicated genotype, L=lipid droplets, M=mitochondria, N=nucleus. B) Liver triglyceride concentrations are reduced in the mINDY−/− mice after a 6 week HFD (n=8). C) Hepatic membrane protein kinase ε content is reduced in mINDY−/− mice (n=4) D) Hepatic diacylglycerol (DAG), and ceramide concentrations as assessed by GC/MS/MS (n=7-8), all error bars represent SEM.
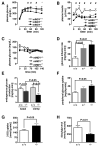
In vivo glucose metabolism in mINDY mice after a 6 week HFD. A) Venous glucose concentrations during an intraperitoneal glucose tolerance test (IPGTT, 1mg/kg BW glucose) in overnight fasted mice of the indicated genotype (n=7-8). B) Venous insulin concentrations during the IPGTT (n=7-8). C) Plasma glucose concentrations during hyperinsulinemic-euglycemic clamp studies (n=7-8). D) Glucose infusion rate during hyperinsulinemic-euglycemic clamp studies is increased with deletion of mIndy (n=6-9). E) Endogenous glucose production in the basal and the clamped state (n=6-9). F) Peripheral glucose uptake during the hyperinsulinemic-euglycemic clamp studies (n=6-9). G) 14C-2-deoxyglucose uptake into gastrocnemius muscle during the hyperinsulinemic-euglycemic clamp is increased with deletion of mIndy (n=5) H) Gastrocnemius muscle diacylglycerol (DAG) content assessed by LC/MS/MS is reduced in mINDY−/− mice (n=5). *P<0.05, #P<0.01 by two way ANOVA, all error bars represent SEM, also see Table S3.
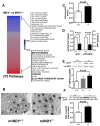
Loss of mIndy enhances mitochondrial metabolism. A) Hepatic gene set enrichment analysis in young mINDY−/− mice compared to young mINDY+/+ mice on a regular chow (n=4-5). B) Representative hepatic mitochondria (M) with similar EM-magnification. C) Mitochondrial density (mitochondrial number/counted cell volume) as assessed by the point counting method by a sample-blinded specialist using electron microscope magnification in liver slices of the indicated phenotype (n=3) D) Hepatic ATP content (left) and ATP/ADP ratio assessed with 31P-MRS after a 24hr fast are reduced in mINDY−/− mice (n=5) E) Representative immunoblots of hepatic AMP activated protein kinase (AMPK) alpha Thr172 phosphorylation/ total AMPK content (n=6). F) Representative immunoblots of hepatic PGC-1α expression (n=6), all error bars represent SEM, see also Figure S5
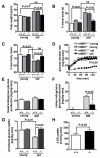
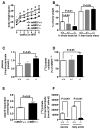
Older mINDY mice are protected from adiposity and insulin resistance. A) Body weight in two-month old (young) and eight-month old mice (old) of the indicated phenotype (n=5-8). B) Proportion of whole body fat to body weight as assessed by 1H magnetic resonance spectroscopy in two-month old (young) and eight-month old mice (old) of the indicated phenotype (n=5-8). The percentage of whole body fat did not change significantly in young compared to old mINDY−/− mice. C) Proportion of total lean body mass as assessed by 1H magnetic resonance spectroscopy in two-month old (young) and eight-month old mice (old) of the indicated genotype (n=5-8). D) Glucose infusion rate during the hyperinsulinemic euglycemic clamp study in three-month old (young) and eight-month old (old) mice of the indicated genotype (n=5-8). Older mINDY−/− were protected from aging related insulin resistance. E) Basal endogenous glucose production in three-month old (young) and eight-month old (old) mice of the indicated genotype (n=6-7). F) Clamp endogenous glucose production in three-month old (young) and eight-month old (old) mice of the indicated genotype (n=6-7). G) Peripheral glucose uptake during the hyperinsulinemic-euglycemic clamp study in three-month old (young) and eight-month old (old) mice of the indicated genotype (n=6-7). H) 14C-2-deoxyglucose uptake into gastrocnemius muscle during the hyperinsulinemic-euglycemic clamp studies in eight-month old mINDY+/+ and mINDY−/− mice (n=6-7), all error bars represent SEM, ns=not significant.
Similar articles
-
Brachs S, Winkel AF, Tang H, Birkenfeld AL, Brunner B, Jahn-Hofmann K, Margerie D, Ruetten H, Schmoll D, Spranger J. Brachs S, et al. Mol Metab. 2016 Aug 13;5(11):1072-1082. doi: 10.1016/j.molmet.2016.08.004. eCollection 2016 Nov. Mol Metab. 2016. PMID: 27818933 Free PMC article.
-
Fan SZ, Sung CW, Tsai YH, Yeh SR, Lin WS, Wang PY. Fan SZ, et al. J Gerontol A Biol Sci Med Sci. 2021 Jan 1;76(1):50-56. doi: 10.1093/gerona/glaa203. J Gerontol A Biol Sci Med Sci. 2021. PMID: 32808644
-
Willmes DM, Kurzbach A, Henke C, Schumann T, Zahn G, Heifetz A, Jordan J, Helfand SL, Birkenfeld AL. Willmes DM, et al. Pharmacol Ther. 2018 May;185:1-11. doi: 10.1016/j.pharmthera.2017.10.003. Epub 2017 Oct 5. Pharmacol Ther. 2018. PMID: 28987323 Review.
-
Pesta DH, Perry RJ, Guebre-Egziabher F, Zhang D, Jurczak M, Fischer-Rosinsky A, Daniels MA, Willmes DM, Bhanot S, Bornstein SR, Knauf F, Samuel VT, Shulman GI, Birkenfeld AL. Pesta DH, et al. Aging (Albany NY). 2015 Dec;7(12):1086-93. doi: 10.18632/aging.100854. Aging (Albany NY). 2015. PMID: 26647160 Free PMC article.
-
The Role of INDY in Metabolic Regulation.
Willmes DM, Birkenfeld AL. Willmes DM, et al. Comput Struct Biotechnol J. 2013 Dec 8;6:e201303020. doi: 10.5936/csbj.201303020. eCollection 2013. Comput Struct Biotechnol J. 2013. PMID: 24688728 Free PMC article. Review.
Cited by
-
Camporez JPG, Kanda S, Petersen MC, Jornayvaz FR, Samuel VT, Bhanot S, Petersen KF, Jurczak MJ, Shulman GI. Camporez JPG, et al. J Lipid Res. 2015 Mar;56(3):526-536. doi: 10.1194/jlr.M054080. Epub 2014 Dec 29. J Lipid Res. 2015. PMID: 25548259 Free PMC article.
-
Metabolic Alterations in Cellular Senescence: The Role of Citrate in Ageing and Age-Related Disease.
Mycielska ME, James EN, Parkinson EK. Mycielska ME, et al. Int J Mol Sci. 2022 Mar 26;23(7):3652. doi: 10.3390/ijms23073652. Int J Mol Sci. 2022. PMID: 35409012 Free PMC article. Review.
-
Growth and Overall Health of Patients with SLC13A5 Citrate Transporter Disorder.
Brown TL, Nye KL, Porter BE. Brown TL, et al. Metabolites. 2021 Oct 29;11(11):746. doi: 10.3390/metabo11110746. Metabolites. 2021. PMID: 34822404 Free PMC article.
-
Rogers RP, Rogina B. Rogers RP, et al. Aging (Albany NY). 2014 Apr;6(4):335-50. doi: 10.18632/aging.100658. Aging (Albany NY). 2014. PMID: 24827528 Free PMC article.
-
Signals from the Circle: Tricarboxylic Acid Cycle Intermediates as Myometabokines.
Maurer J, Hoene M, Weigert C. Maurer J, et al. Metabolites. 2021 Jul 23;11(8):474. doi: 10.3390/metabo11080474. Metabolites. 2021. PMID: 34436415 Free PMC article. Review.
References
-
- Bergeron R, Ren JM, Cadman KS, Moore IK, Perret P, Pypaert M, Young LH, Semenkovich CF, Shulman GI. Chronic activation of AMP kinase results in NRF-1 activation and mitochondrial biogenesis. Am. J. Physiol Endocrinol. Metab. 2001;281:E1340–E1346. - PubMed
-
- Bosca L, Aragon JJ, Sols A. Modulation of muscle phosphofructokinase at physiological concentration of enzyme. J. Biol. Chem. 1985;260:2100–2107. - PubMed
Publication types
MeSH terms
Substances
Grants and funding
- R01 AG023686-08/AG/NIA NIH HHS/United States
- R01 DK-40936/DK/NIDDK NIH HHS/United States
- U24 DK-59635/DK/NIDDK NIH HHS/United States
- U24 DK059635/DK/NIDDK NIH HHS/United States
- P30 DK-45735/DK/NIDDK NIH HHS/United States
- R01 AG023686/AG/NIA NIH HHS/United States
- P30 DK-034989/DK/NIDDK NIH HHS/United States
- P30 DK034989/DK/NIDDK NIH HHS/United States
- HHMI/Howard Hughes Medical Institute/United States
- R37 AG-16667/AG/NIA NIH HHS/United States
- R01 DK040936-23/DK/NIDDK NIH HHS/United States
- R37 AG016667/AG/NIA NIH HHS/United States
- R01 DK040936/DK/NIDDK NIH HHS/United States
- RF1 AG024353/AG/NIA NIH HHS/United States
- R24 DK085638/DK/NIDDK NIH HHS/United States
- R37 AG016667-14/AG/NIA NIH HHS/United States
- P30 DK045735/DK/NIDDK NIH HHS/United States
- U24 DK059635-06/DK/NIDDK NIH HHS/United States
- ImNIH/Intramural NIH HHS/United States
LinkOut - more resources
Full Text Sources
Other Literature Sources
Molecular Biology Databases